Thesis Konstantinos Batogiannis
Titel thesis: Exploring Gender-Based Stereotypical Employee Drives: A Comparative Study of Government and Commercial Sectors
First examiner: Lynda Hardman
Second examiner: Alex Telea
Candidate: Konstantinos David Batogiannis
External supervisor: Manon Jansen
Applied data science thesis: July 2023
Abstract
This study explores gender-biased drives within the Government sector and Commercial industries. By focusing on four specific drives, namely Dominance, Decision Making, Social Empathy, and Helping, the aim is to uncover the extent to which employees in these sectors conform to stereotypical male and female drives in order to aid Talent Motivation Analysis (TMA) foster gender equity and mitigate the effects of these biases. Through an analysis of data and visualization, significant disparities and deviations from gender stereotypes are identified within and between the sectors. The findings reveal that while there are subtle differences in drives between the Government sector and Commercial industries, the overall dissimilarities are relatively minimal. The study reveals distinct gender-based patterns within each sector, illustrating variances in Dominance, Decision Making, Social Empathy, and Helping. However, these differences have minimal practical significance, as indicated by their small or negligible effect sizes. The study acknowledges limitations, including missing data and the absence of certain variables, and provides recommendations to advance gender equality in decision-making and establish inclusive work environments. In summary, this research acts as a guide for TMA, emphasizing the importance of challenging gender stereotypes, promoting equal opportunities, and ensuring fair treatment for employees regardless of gender.
1. Introduction
1.1. Motivation and context
Organizations have a strategic imperative to advance gender equity and diversity. Numerous studies have demonstrated that inclusive and diverse organizations foster greater creativity, productivity, and success (Mousa et al., 2020). By utilizing the insights acquired from this research, organizations may unleash the full potential of their workforce and develop settings that draw in bright people from all gender backgrounds and empower them (Miller & Katz, 2002).
Workplace gender stereotypes and biases influence an individual’s behavior, career paths and opportunities along the way (Eagly & Karau, 2002; Heilman, 2012). These biases can appear in various ways in a work environment, including differences in work motivations between genders (Eagly & Carli, 2007). These motivations are called drives by TMA. Promoting gender equality and developing inclusive work environments requires an understanding of the extent to which these biases exist within particular sectors. This study investigates and contrasts a number of gender-biased drives in the Government and Commercial sectors, using the dataset provided by TMA, with the goal of shedding light on potential differences and their implications.
Talent Motivation Analysis (TMA) is a global company that helps clients worldwide hire the right people, develop, and motivate them onward their careers and truly support clients with their talent management goals. More specifically, the TMA Method is a talent-oriented approach to selection, development, and assessment of employees. It is a tool that helps HR professionals, managers, and executives to understand the relationship between talents and competencies and to identify the competencies that are necessary for optimal performance.
The TMA company provided a dataset which includes information on 99759 employees across multiple sectors. The dataset includes data on competency and drive scores, demographic factors about each employee, such as gender, age, and educational level. By examining the two aforementioned sectors and performing the right tests, we can gain valuable insights into the drives that are considered gender-biased in the workplace.
The exploration of gender biases in the workplace was inspired by previous studies such as Heilman's 2012 paper titled "Gender stereotypes and workplace bias." Heilman's work claims the existence of specific male (e.g., dominance and decision-making) and female (e.g., social empathy and helping) stereotypical drives, which may influence individuals' behavior and career choices (Heilman, 2012; Eagly & Carli, 2007; Carli, 2001). The goal is to build upon these findings and discover the extent to which the Government and the Commercial sector employees adhere to these gender stereotypical drives based on the TMA dataset.
The study also draws inspiration from Buelens’ and Van den Broeck's (2007) examination of variations in workplace motivation between firms in the public and private sectors in general. Their study sheds light on potential differences in job motivation, which can give a foundation for comprehending the gender-biased motivations seen in the public and private sectors.
The results of this study will act as a roadmap for the TMA corporation, as it will help them guide other businesses towards achieving workplace fairness. Organizations can
conduct tailored interventions to challenge and eliminate these biases by understanding the particular motivations and patterns of gender bias within the public and private sectors. By gaining insights into the gender-biased drives present in different industries, organizations can develop targeted interventions and strategies to foster gender equity and mitigate the effects of these biases (Kepuladze & Kardava, 2010). Organizations will be able to build more inclusive people management strategies, strengthen diversity programs, and develop welcoming cultures that promote individual development and advancement regardless of gender thanks to this research.
1.2. Literature overview
Since the research question revolves around gender-biased motivations, the literature delves more into the differences that exist in a workplace between males and females and how these values are perceived. Through this study we aim to further instigate these differences in motivations in four particular drives in the Government and Commercial sectors based on the dataset that TMA has provided.
The foundation for comprehending the existence of biases and stereotypes in companies is laid by Heilman's (2012) study on gender stereotypes and workplace bias. This essay contributes to the framing of the research issue by emphasizing the importance of researching gender-biased motives in many fields. More specifically, one key point of the paper is that it examines the impact of gender stereotypes on workplace biases. The study highlights the existence of gender-based stereotypical drives, such as dominance and decision-making for males, and social empathy and helping for females. It sheds light on how these stereotypes can influence workplace dynamics and contribute to biases in the Government and Commercial sectors. By addressing these key points, the research aims to contribute to a deeper understanding of gender biases and drives in the workplace.
By examining the variations in workplace motivation between firms in the public and private sectors, Buelens and Van den Broeck (2007) offers insights into possible changes in drives between the two sectors, which can aid in addressing the general discrepancies in drives between the government and private sectors.
By analyzing the experiences of women in leadership positions and the role congruity theory of discrimination against female leaders, Eagly and Carli (2007) and Eagly and Karau (2002) shed light on conventional gender-based motivations like dominance, decision-making, social empathy, and helping. Understanding these patterns will help us more accurately determine if and how these drivers are present in both the government sector and commercial industries of the economy.
Miller and Katz (2002) work contributes by highlighting the value of inclusion and diversity in workplaces. In order to eliminate gender prejudices and encourage various motivations, this research offers a broader view on the potential consequences of inclusive work settings. The key point of the paper, which emphasizes the importance of inclusion in harnessing the power of diversity, can be applied to the investigation of gender biases and drives. By promoting inclusivity, organizations can create an environment where individuals feel valued and respected regardless of their gender, allowing for a more accurate assessment of the extent to which employees in the Government and Commercial sectors conform to specific gender-based stereotypical drives.
Stead's (2009) paper specifically investigates the effect of gender on motivation to work. The study explores how gender influences an individual's motivation in the workplace. By analyzing data and conducting surveys, Stead provides valuable insights like the need for power by men and the need for affiliation by women, thus further embracing the investigated stereotypes of this study. By considering the findings from Stead's (2009) research on the effect of gender on motivation to work, we can gain valuable insights into the specific factors that shape motivation levels for individuals of different genders.
1.3. Research questions and goals
The research question revolves around the gender biased drives in a workplace. According to the motivation and the aforementioned literature we will investigate the differences in the drives between the Government sector and Commercial industries. Hence, the following research question was formed:
“To what extent do Government and the Commercial employees conform
to specific male (Dominance, Decision_making) and female (Social_empathy,
Helping) stereotypical drives?”
These 4 specific drives were chosen because of the claims of the paper by Heilman 2012, named Gender stereotypes and workplace bias. This paper examines gender stereotypes and biases in the workplace, offering valuable information to address research objectives. To better answer the research question, there are three sub-questions that will help define the answer. These are the following:
Are there any significant differences in Drives between the two sectors?
What patterns of gender-based stereotypical Drives can be distinguished within the two sectors?
What patterns of gender-based stereotypical Drives can be distinguished between the two sectors?
2. Data and methods
2.1. Description of the data
The dataset was provided by TMA, and it represents 99759 employees across all
industries as its rows and there are multiple columns representing talents, competencies as well as information on each employee. There are 13 columns which act as general information about each employee which is not directly correlated with Competencies and Talents. Industry and Gender are the only 2 variables out of these 13 that will be useful for the purposes of this research.
Competencies are a set of qualities, knowledge, and behaviors that are necessary to properly perform a certain role, whether in private or work situations. Competencies based on the TMA method are 45 in total for each person. According to TMA, Competencies represent measurable skills, abilities and knowledge that are necessary for an employee to perform a task with efficiency, and they are influenced by the work environment. These can be both technical and behavioral, and they can be developed and even improved over time with training. The 45 columns that are classified as competencies were not represented correctly in the dataset, hence the decision not to use them was made.
Drives cover 44 columns in the dataset as they are divided into 22 normalized drive scores and 22 raw drive scores. These 22 normalized drive scores are the main focus of the study as they are examined in order to verify the existence of disparities between genders. Drives represent the degree of need, and they are measured by having the candidate choose the answer that best fits their character from a set of answers. There are two tests. One that contains 312 items and one that contains 170. Iteratively, by filling out the questionnaire a map of drives is being formed for each candidate and thus the results describe their preferred behavior. Regarding the normalized scores, per motive a score from 1 to 9 is reported with accompanying texts and follow an ordinal distribution (Table A). TMA distinguishes three categories, low need, medium need, and high need. Scoring 1 to 3 or 7 to 9 in a drive results in having a talent for a certain thing, exceptionally falling within the 16% of the Dutch working population. Scoring, however, 4 to 6 means that this person falls within the largest group of the Dutch working population of 68% and thus not showing any tendencies towards a certain talent. So, by mapping these drives and talents, a statement can be made about the preferred behavior of people. Understanding the talent ranges is essential to correctly interpret the results and answer the research questions. Through their choices, the candidates build a profile based on their talents by completing the questionnaire. The raw scores consist of the number of times that someone has chosen an answer that fits a certain drive. In order for raw scores to be interpreted accurately they are transformed into normalized scores. In other words, the raw scores act as counters and count the times that each participant made a positive selection towards a motivation. Then, depending on the range of raw scores of each drive the respective normalized score is assigned to each participant.
Finally, there are 5 columns that contain more information for each candidate. Namely, Year of birth, Age, Country of birth, Educational level, Primary job. These 5 particular columns were the least filled out by the candidates as this final part was optional in the questionnaire and thus there is a lot of missing data. Namely nearly only 1/4th of the total population filled these variables in. Gender has as its values Man and Woman. Age ranges from 16 to 73 years old for each gender. Educational level has as its values 0, 1, 2 signifying Primary education, Secondary education, Higher education accordingly. Because these variables considerably lowered the number of employees when the missing values were dropped, they were excluded from the research.
All the values referring to the identities of the employees have been randomized or anonymized in order to protect their privacy.
2.2. Preparation of the data
There are columns with a lot of missing values as well as columns that are not necessary for this analysis. Before tackling the problem of missing data, all columns that were associated with Competencies and Raw count of Drives were removed as they provided no value to the research.
Since the research goal is to investigate the Government and the Commercial sectors,
two new sub-datasets were created named gov_df and com_df representing each industry respectively and containing all the information about their employees along with their respective normalized drive scores. By dividing the dataset into two sub-datasets, it can be deduced that the total number of Government employees is 14139 and the total number of Commercial employees is 13663.
In order to answer sub-question 1 regarding the differences in drives between the two industries, gov_drives and com_drives were created to isolate and capture all the drives exhibited within each industry.
For the analysis to be performed within and between the two sectors, further dividing the datasets according to gender became necessary. More specifically, g_man and g_woman represent the Government males and females, respectively. The same is applied for c_man and g_man in the Commercial sector. The male Government employees are 5511 and the women are 8620. The Commercial males are 7121 and the women are 6535.
2.3. Methods
Program specifications
The program in which the code was written and executed was Python and several libraries were used to run the tests and create visualizations. More specifically, numpy and pandas were used to manipulate and reform the data, matplotlib and seaborn were used to create visualizations. Furthermore, from scipy.stats: shapiro to test the normality of the data and mannwhitneyu to test for differences between groups. Lastly, cliffs_delta was used in order to measure the effect size each group had on specific drives.
Difference in populations: Problem and Solution
To answer any of the research questions posed earlier, we need to perform some comparisons. However, it can be noticed that the population of each dataset is different, thus making it impossible to perform tests without the presence of bias. Hence, resampling techniques were deemed necessary in order to perform these comparisons. There are two cases where we compare datasets against one another:
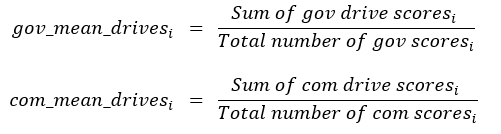
The first case is where we compare the averages of the drives of the two sectors. In other words, comparing the datasets gov_drives (14139) with com_drives (13663). Despite the difference between the two populations not being too large, a measure had to be taken in order to assure the reproducibility of the results and the mitigation of potential selection bias. The method that was used to mitigate the bias of just selecting 13663 government employees randomly, was to randomly sub-sample the population of government employees 100 times and calculate their average scores across each iteration. This method is called bootstrapping. This means that 100 times 22 drives of a different set of 13663 people is being selected and their average is being calculated and is input in a list. Finally, the averages of all 22 drives that exist 100 times in this list are calculated in order to mitigate the bias of selecting randomly once a subset of 13663 people.
Initialize an empty list, let's call it "bootstrap_averages".
Repeat
the following steps k times (where k = 100): a. Randomly select a subsample of size n (13663) from the gov_drives dataset. b. Calculate the average score for the selected subsample. c. Append the calculated average score to the "bootstrap_averages" list.
Calculate the average of the values in the "bootstrap_averages" list. This will give you the estimated average score for the entire population of government employees, mitigating selection bias.
The second case is where we compare men against women in both sectors and we have to fairly equalize their population differences by using a method called stratified sampling. The same is applied for the comparison of men across sectors and women across sectors. More specifically, the dataset gov_clean_drives was further divided into g_man (Government males: 5511), g_woman (Government females: 8620) and com_clean_drives into c_man (Commercial males: 7121), c_woman (Commercial females: 6535). To combat this problem, the datasets were randomly sub-sampled to 5000 observations each so that the comparison groups have an equal representation of men and women in each sector. (Sharma, 2017) This allowed all the desirable comparisons to be performed without bias while accounting for population differences.
Type of Data and Normality
The data regarding the drives of each employee were employed in the dataset in and ordinal fashion. Ordinal data is a type of categorical data that its categories have a
ranking, meaning that the categories in this particular case regarding the NORM scores are from low to high and range from 1 to 9. Typically, ordinal data represent different levels of a variable and that is the reason why it is usually mentioned with Likert-style response items (Liddell & Kruschke, 2018). Examples of ordinal data include survey responses that use Likert scales (e.g., strongly agree, agree, neutral, disagree, strongly
disagree). In these cases, the categories can be ordered from lowest to highest or from least to most, but the difference between each category may not be quantifiable or consistent. (Liddell & Kruschke, 2018). However, ordinal data are frequently skewed or multi-modal, so they violate the assumption of normal distribution (Ghosh et al., 2018) making the use of an Analysis Of Variance (ANOVA) model impossible as it violates one of its core assumptions about residual normality. Hence, we resort to non-parametric methods of analysis that are more robust to residual and data normality. In this study the two non-parametric methods Mann-Whitney U test and Cliff’s delta were utilized
to draw conclusions.
Differences regarding all drives between the two sectors
Finding all the differences between the two industries required isolating each of the
drives for each industry and calculating their means without including any other variables. The differences between the two means of the drives were calculated and visualized. In the visualizations error bars were included in order to account for the variability of the data and measure their means error. Standard error is a measure of the precision of the estimated sample statistic (such as the mean or proportion) and reflects the likely variability of this statistic across different samples. It plays a crucial role in hypothesis testing and constructing confidence intervals (Altman & Bland, 2005).
Mann-Whitney U test to identify significant differences between groups
In order to examine the differences between the two independent groups, such as Man and Woman, in terms of the four gender-biased drives, a Mann-Whitney U test was used. The Mann-Whitney U test is a non-parametric test used to compare the distributions of two independent groups when the assumptions for parametric tests such as the t-test are not met (Mann & Whitney, 1947). Furthermore, this test is robust to violations of normality assumptions and is suitable for analyzing ordinal or continuous data (Nachar, 2008). The null hypothesis (H0) for the test claims that there is no significant difference between male and female distributions in terms of the drive being investigated, while the alternative hypothesis (H1) claims that there is a significant difference between the distributions of the two groups. The test was conducted for all the investigated drives between the two groups of male and female and the significance level was set at α = 0.05, meaning that a p-value below this threshold was considered statistically significant. However, before applying this test a few assumptions (Nachar, 2008) need to be true:
a) The data should follow an ordinal scale or continuous.
b) The observations should come from different groups and should be independent of
each other. In other words, every observation must belong to a different employee in order to ensure independence both within and between groups.
c) The sample should be randomly selected. This helps generalize the findings, but the
bigger the sampled data the more precise the outcome.
Cliff’s Delta for effect size
Cliff’s delta (δ) is used to measure the magnitude of the differences. Cliff's delta, which
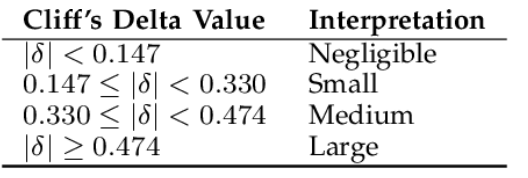
ranges from -1 to +1, indicates the amount of overlap between two sample distributions. When both groups' intersections are empty sets, the extreme value 1 occurs. Cliff's Delta approaches 0 when the groups being compared have a tendency to overlap (Wan et al., 2021). Below are provided the formula (Hess & Kromrey, 2004) of Cliff’s Delta and the interpretations for the ranges of Cliff’s Delta values (Wan et al., 2021).
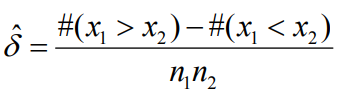
x1: scores within group 1
x2: scores within group 2
n1: group 1 sample size
n2: group 2 sample size
#: cardinality symbol indicating counting (Macbeth et al., 2011).
Cliff's delta can also be calculated from the common Mann-Whitney U statistic (Goedhart, 2016).
It is worth mentioning that Cliff's delta is robust against violations of normality
assumptions and unequal variances, making it a suitable effect size measure for non-parametric tests like the Mann-Whitney U test. (Macbeth et al., 2011)
Cliff’s delta was used in combination with Mann-Whitney U test to assess the significance and the effect size of differences of particular gender-biased drives within (sub-question 2) and between (sub-question 3) the Government sector and the Commercial industries based on gender. In other words, Cliff's delta provides information about the direction and strength of the relationship between the two groups, considering the ordinal nature of the data.
3. Results
3.1. Differences of all drives between the two sectors
The first sub-question can be answered by finding and comparing the differences between the averages of all Government employees (14139) and all Commercial employees (13663) in every drive. As stated in the methodology section, to achieve an unbiased comparison between the two different populations a sub-sampling and re-calculating the averages of the government employees’ dataset is performed 100 times. Below the averages and their respective differences are provided.
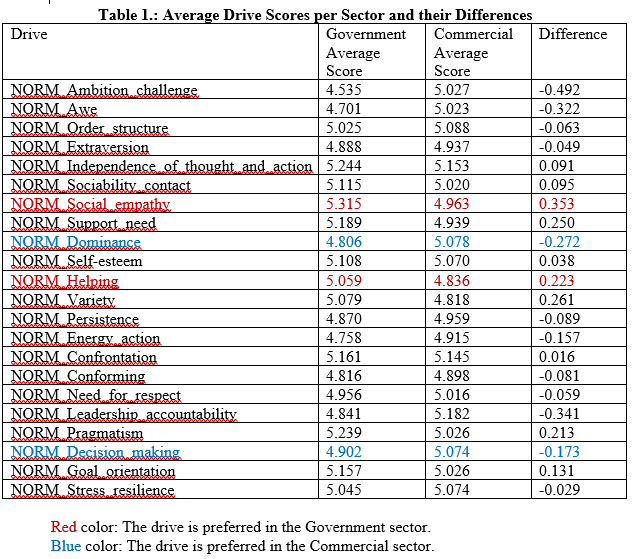
In order to get a better understanding of the values above the following visualizations were created for the drives and their differences.
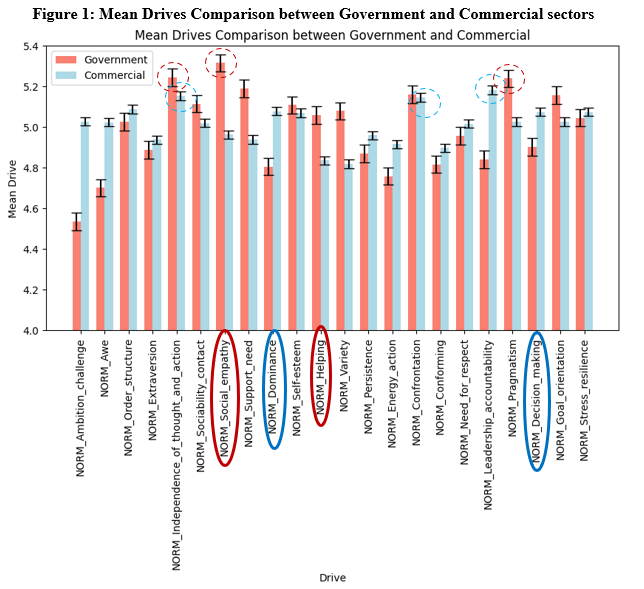
In Figure 1 the three highest scoring drives for Government employees, as indicated by the dashed red circles, are Social Empathy, Independence of thought and action, and Pragmatism, while the three highest scoring drives for Commercial employees, as indicated by the dashed blue circles, are Leadership accountability, Independence of thought and action, and Conformation. Furthermore, it can be deduced from the Figure that the error in each drive is very small.
Social Empathy for the Government sector is key as increased understanding and connection with the emotions and experiences of others can foster a heightened commitment to enhancing the well-being of others (Sokoloff, 2012). Individuals with elevated levels of empathy are more inclined to view the participation of a broader governing entity as valuable in safeguarding societal welfare (Hoffman, 2011). The drive for Independence of thought and action empowers Government employees to exercise critical thinking and make decisions based on their own judgment. It enables them to challenge existing norms and explore innovative solutions (Hofstede, 2001). This drive cultivates a culture of independent thinking, allowing Government officials to adapt to complex challenges and develop creative strategies. Pragmatism emphasizes a practical and solution-oriented approach to problem-solving. In the Government sector, it is essential for officials to consider available resources and implement feasible solutions to address societal challenges (Hood, 1995). This drive enables Government employees to navigate complex issues effectively, balance competing interests, and deliver tangible results for the public.
Leadership accountability is a crucial drive in the Commercial sector, emphasizing the responsibility of leaders to be answerable for their actions and decisions. It fosters trust, integrity, and ethical conduct within organizations (Brown, Treviño, & Harrison, 2005). Commercial employees value leaders who demonstrate transparency, take ownership of their responsibilities, and are accountable for the outcomes of their decisions. Independence of thought and action: Similar to the Government sector, Independence of thought and action is highly valued in the Commercial sector as well. It encourages employees to think independently, challenge existing practices, and bring forth innovative ideas (Amabile & Khaire, 2008). This drive promotes a culture of creativity, adaptability, and entrepreneurial thinking, enabling commercial organizations to stay competitive in dynamic markets. Conformity is another significant drive in the Commercial sector, referring to the inclination to adhere to established norms, rules, and expectations within the organization. It ensures consistency, coordination, and unity among employees (Schein, 1990). While encouraging conformity, organizations must also strike a balance with independent thinking to avoid stifling creativity and innovation.
Having justified the three top scoring drives of each sector it is worth looking into the differences between all the drives across the two sectors as well. This can be achieved efficiently through the following Figure which showcases the results of the “Difference” column from Table 1.
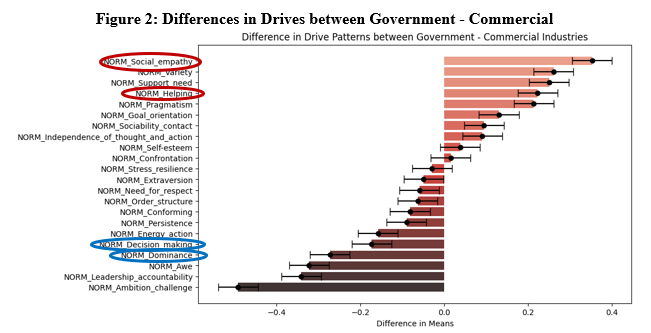
In order to comprehend Figure 2, the x axis scale shows how different the drives are between the two sectors. If the score difference is positive (right side), then that drive scores larger in the Government sector on average. The biggest differences are represented by Social empathy, Variety, and Support need exceeding their respective average scores of the commercial sector by more than 0.2. On the other hand, if the score difference is on the negative side (left side), then that drive scores larger in the Commercial sector on average. The most important and largest differences being in the drives of Ambition challenge, Leadership accountability, and Awe surpassing their counterparts in the Government sector by more than 0.3 on average.
The average difference of all four gender-biased drives are statistically significant when comparing the two sectors. More precisely, Dominance and Decision-making score higher on average in the Commercial sector rather than the Government sector. This suggests that individuals in the commercial sector may exhibit a greater inclination towards assertiveness, influence, and taking charge in their work (Buelens & Broeck, 2007). The exact opposite point can be made for the drives of Social empathy and Helping. This implies that individuals working in the government sector may demonstrate a stronger tendency towards understanding and empathizing with others, as well as being motivated to provide assistance and support (Buelens & Broeck, 2007).
The error bars of the differences indicate what Drives are statistically significant. Drives that include or are close to 0 difference between the two sectors tend to be insignificant. According to the Figure the drives of which their difference across sectors is insignificant are Stress resilience, Confrontation, Self-esteem, and Independence of thought and action. This can further be supported utilizing the Mann-Whitney U test, comparing each drive from each sector, and finding out whether their mean difference is significant. According to the Figure, the four seemingly insignificant mean differences are further validated by the following results:
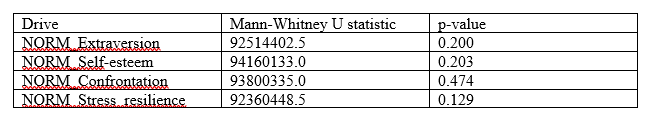
Since the p-values exceed 0.05 (confidence interval of 95%) we can safely deduce that these 4 drives show insignificant differences across the two sectors.
3.2. Differences WITHIN the two sectors
The drives that were investigated are NORM_Dominance, NORM_Decision_making, which are believed to be male stereotypical drives in a workplace, and NORM_Social_empathy, NORM_Helping, which are considered to be female stereotypical drives (Heilman, 2012). An analysis within each sector was conducted to find whether the differences between male and female preferences and drive scores are statistically significant between the two genders. In total, there were 8 comparisons: 4 each for the Government and the Commercial sector. Finally, in an effort to mitigate the bias regarding the difference in population between the datasets, stratified sampling of 5000 was performed, effectively reducing all four datasets to a random selection of 5000 employees from each one, as mentioned in section 2.3.
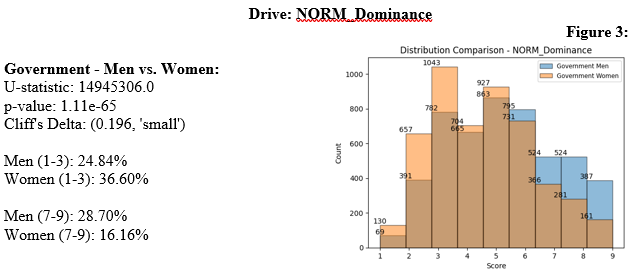
It is suggested that there is a statistically significant, but relatively small, difference between men and women in the studied drive within the Government sector. The p-value of Mann-Whitney U test is smaller than 0.05 and thus there is sufficient evidence that the null (H0) hypothesis can be rejected. This means that the scores between Men and Women in the Government sector regarding the Dominance drive are significantly different. More specifically, by using Cliff’s Delta we get a positive effect size of 0.196 and is classified as ‘small’. The effect being positive implies that Government Men score higher in the Dominance drive than Governement Women. This statement can be further supported by looking at Figure 3 on the right as it shows that men tend to score higher than women. Big differences can be observed in the higher numbers 7,8,9 and lower numbers 1,2,3. More women than men in the Government sector show the talent of being Cooperative by scoring low (1,2,3) in the Dominance drive, whereas more men than women show the talent of Directing by scoring higher in the Dominance drive (7,8,9). However, the effect size is classified as small according to the Cliff’s Delta Scale.
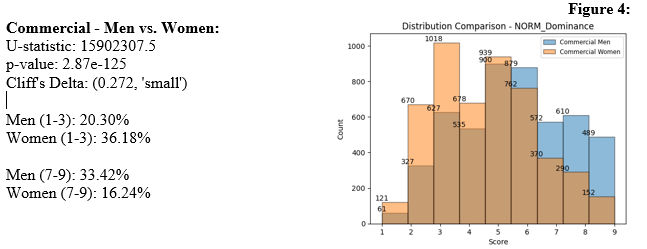
It is suggested that there is a statistically significant, but relatively small, difference between men and women in the studied drive within the Commercial sector. The p-value of Mann-Whitney U test is smaller than 0.05 and thus there is sufficient evidence that the null (H0) hypothesis can be rejected. This means that the scores between Men and Women in the Government sector regarding the Dominance drive are significantly different. More specifically, by using Cliff’s Delta we get a positive effect size of 0.272 and is classified as ‘small’. The effect being positive implies that Commercial Men score higher in the Dominance drive than Commercial Women. This statement can be further supported by looking at Figure 4 on the right as it shows that men tend to score higher than women. Big differences can be observed in the higher numbers 7,8,9 and lower numbers 1,2,3. More women than men in the Commercial sector show the talent of being Cooperative by scoring low (1,2,3) in the Dominance drive, whereas more men than women show the talent of Directing by scoring higher in the Dominance drive (7,8,9). However, the effect size is classified as small according to the Cliff’s Delta Scale. Compared to the Government sector difference, it appears that the difference between male and female in the Dominance drive is relatively bigger in the Commercial sector.
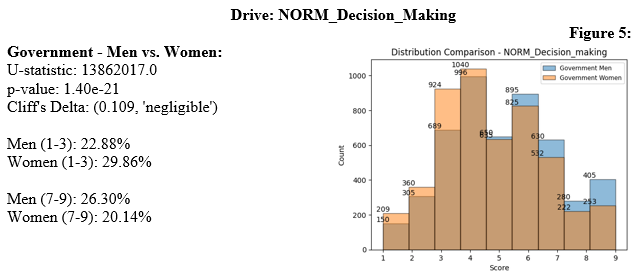
Although the difference is statistically significant, it is relatively very small. The p-value of the Mann-Whitney U test is smaller than 0.05, indicating that there is sufficient evidence to reject the null hypothesis. This means that the scores between men and women in the Government sector regarding the Decision Making drive are significantly different. However, the effect size, as measured by Cliff's Delta, is classified as 'negligible' with a positive value of 0.109. Figure 5 shows a slight difference between men and women in the higher scores, suggesting that men tend to have slightly higher scores in Decision Making compared to women, meaning that more men than women in the Government sector are problem-solvers.
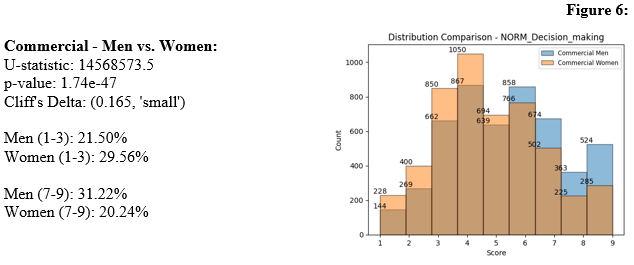
The effect size, as measured by Cliff's Delta, is classified as 'small' with a positive value of 0.165. Figure 6 shows a noticeable difference between men and women in the higher scores, indicating that men tend to have higher scores in Decision Making compared to women. The effect size suggests a statistically significant, but relatively small, difference between men and women in the studied drive within the Commercial sector. Compared to the Government sector difference, it appears that the difference between male and female in the Decision making drive is slightly bigger in the Commercial sector.
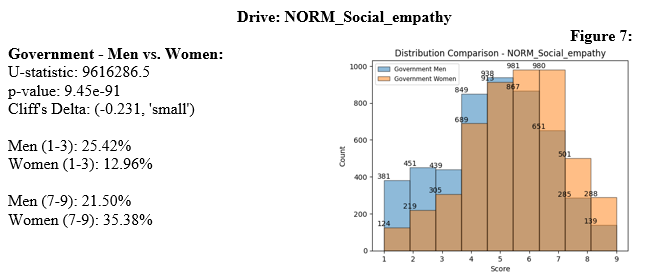
The effect size suggests a statistically significant, but relatively small, difference between men and women in the studied drive within the Government sector. This means that since more women score higher in social empathy than men, they have the talent of being Empathetic, while more men score lower in this drive and hence have the talent of being more Factual than women in the Government sector. Figure 7 shows a clear difference between men and women, with women tending to have higher scores in Social Empathy compared to men.
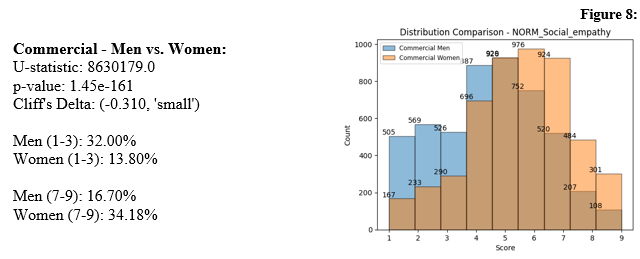
The effect size suggests a statistically significant difference between men and women in the studied drive within the Commercial sector. The effect size, as measured by Cliff's Delta, is classified as 'small', but is very close to being classified as a ‘medium’ difference, with a negative value of -0.310. The effect size suggests a statistically significant difference between men and women in the studied drive within the Commercial sector. Figure 8 shows a noticeable difference between men and women, with women having higher scores in Social Empathy compared to men. Here, the number of men that scored lower (1,2,3), implying the talent of them being Factual, is more than double regarding the amount of low scoring women. The exact oposite can be said for the higher scores (7,8,9), implying the talent of Empathetic, with the amount of women being more than double of that of men. It is worth noting that the difference between genders for this particular case is larger than the difference in the Government sector.
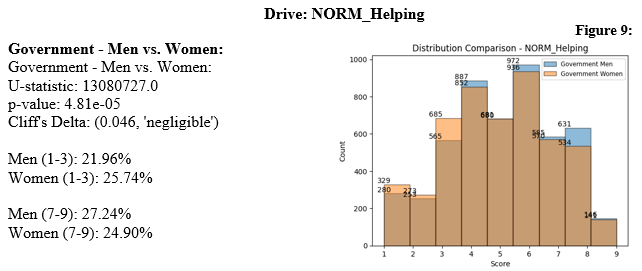
The p-value of the Mann-Whitney U test is smaller than 0.05, indicating a significant difference in scores between men and women in the Government sector for the Helping drive. However, the effect size, as measured by Cliff's Delta, is classified as 'negligible' with a positive value of 0.046. Figure 9 shows a minimal difference between men and women in the scores, suggesting that there is no substantial distinction between genders in the Helping drive within the Government sector.
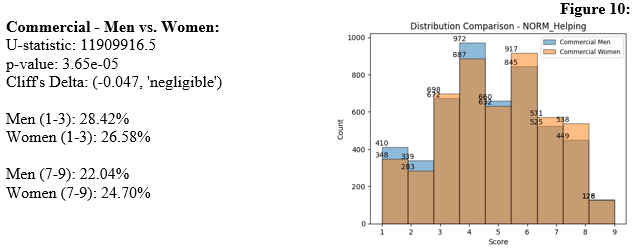
The p-value of the Mann-Whitney U test is smaller than 0.05, indicating a significant difference in scores between men and women in the Commercial sector for the Helping drive. However, the effect size, as measured by Cliff's Delta, is classified as 'negligible' with a negative value of -0.047. Although, women appear to be more helpful than men in the Commercial sector, the difference between the two genders’ distribution is barely noticible. Figure 10 shows a minimal difference between men and women in the scores, suggesting that there is no substantial distinction between genders in the Helping drive within the Commercial sector.
3.3. Differences BETWEEN the two sectors
In addition to analyzing the differences within each sector, we also examined the disparities between the Government and Commercial sectors. This analysis aimed to determine whether there are significant variations in preferences and drive scores between the two sectors, considering both male and female employees. The following section presents the results of these comparisons for each drive.
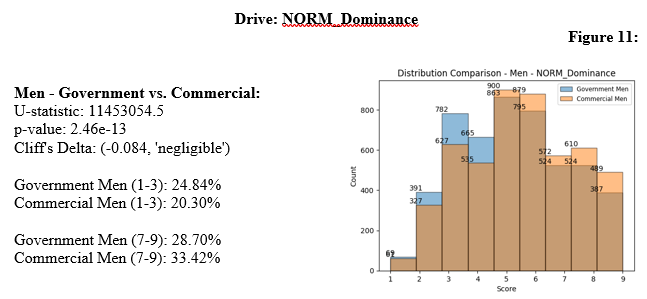
The difference between men's scores in the Dominance drive between the two sectors is minimal. The Mann-Whitney U test revealed a significant difference in scores between men in the Government and Commercial sectors for the Dominance drive. The p-value was smaller than 0.05, indicating sufficient evidence to reject the null hypothesis. However, the effect size, as measured by Cliff's Delta, was classified as 'negligible' with a negative value of -0.084. This implies that Commercial men tend to score higher in the drive of Dominance than Government men. Therefore, while there is a statistically significant distinction, it is not practically meaningful.
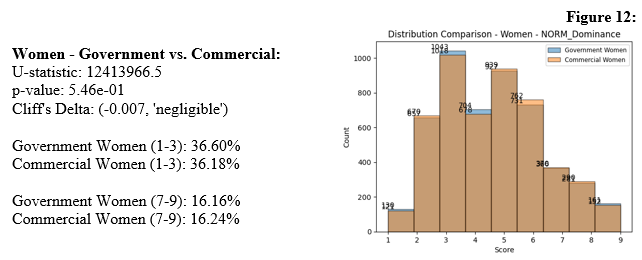
For women in the Government and Commercial sectors, the Mann-Whitney U test did not reveal a significant difference in scores for the Dominance drive. The p-value was larger than 0.05, indicating that there is insufficient evidence to reject the null hypothesis. The effect size, measured by Cliff's Delta, was also classified as 'negligible' with a negative value of -0.007. This suggests that there is a negligible difference in the Dominance drive scores between women in the two sectors and as seen in Figure 12 the differences are very marginal.
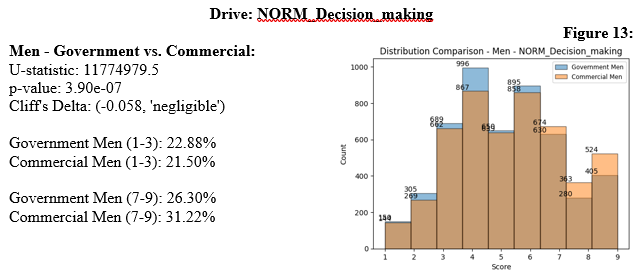
The Mann-Whitney U test indicated a significant difference in scores between men in the Government and Commercial sectors for the Decision Making drive. The p-value was smaller than 0.05, providing enough evidence to reject the null hypothesis. However, the effect size, as measured by Cliff's Delta, was classified as 'negligible' with a negative value of -0.058. Slightly more Commercial men score higher in the Decision-making drive as it can be concluded by Cliff’s Delta and Figure 13. This suggests that the disparity in Decision Making drive scores between men in the two sectors is relatively small.
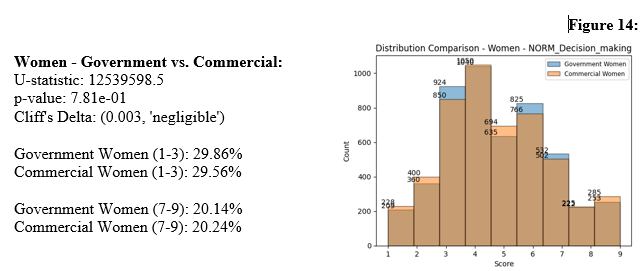
Similarly, for women in the Government and Commercial sectors, the Mann-Whitney U test revealed a significant difference in scores for the Decision Making drive. The p-value was smaller than 0.05, indicating sufficient evidence to reject the null hypothesis. However, the effect size, as measured by Cliff's Delta, was classified as 'negligible' with a positive value of 0.003. This implies that the practical difference in the Decision Making drive scores between women in the two sectors is minimal.
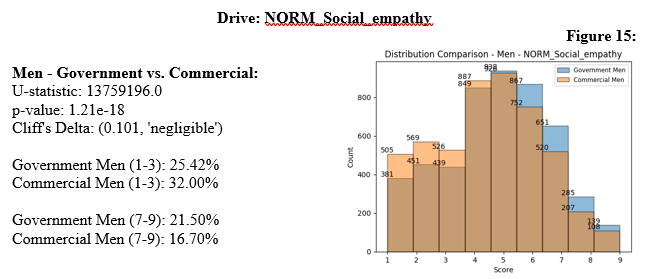
The Mann-Whitney U test demonstrated a significant difference in scores between men in the Government and Commercial sectors for the Social Empathy drive. The p-value was smaller than 0.05, suggesting sufficient evidence to reject the null hypothesis. More government males, according to Cliff’s Delta and Figure 15, tend to score higher in Social empathy than Commercial males. However, the effect size, as measured by Cliff's Delta, was classified as 'negligible' with a positive value of 0.101. This indicates that the disparity in Social Empathy drive scores between men in the two sectors is relatively small.
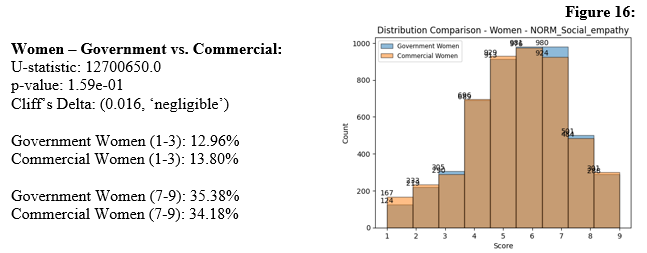
For women, the Mann-Whitney U test did not reveal a significant difference in scores for the Social Empathy drive between the Government and Commercial sectors. The effect size, measured by Cliff’s Delta, was classified as ‘negligible’ with a positive value of 0.016. This suggests that there is a negligible difference in the Social Empathy drive scores between women in the two sectors.
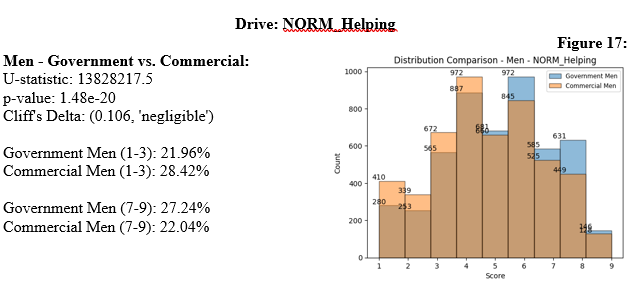
The Mann-Whitney U test revealed a significant difference in scores between men in the Government and Commercial sectors for the Helping drive (U-statistic: 13828217.5, p-value: 1.476244716385913e-20). The effect size, measured by Cliff's Delta, was classified as 'negligible' with a positive value of 0.106. This indicates that the disparity in Helping drive scores between men in the two sectors is relatively small. Although, it can be noticed that more Government males tend to score higher than Commercial males, but the amount is small and thus considered insignificant. The same holds true about Commercial males scoring lower than Government males in this Drive.
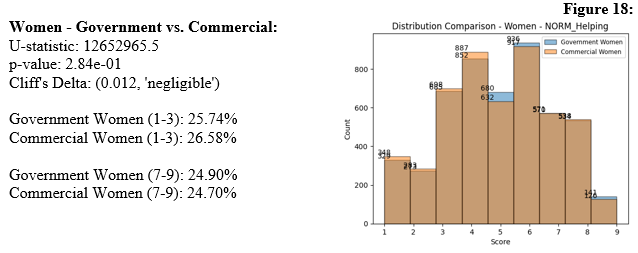
For women, the Mann-Whitney U test did not reveal a significant difference in scores for the Helping drive between the Government and Commercial sectors (U-statistic:
12652965.5, p-value: 0.2844669767804686). The effect size, measured by Cliff's Delta, was classified as 'negligible' with a positive value of 0.012. This suggests that there is a negligible difference in the Helping drive scores between women in the two sectors.
4. Conclusion and discussion
This study aimed to investigate the presence of gender-biased drives in the Government sector and Commercial industries, focusing on four specific drives: Dominance, Decision Making, Social Empathy, and Helping. The research question sought to explore the extent to which employees in these sectors conform to stereotypical male and female drives in their respective workplaces.
To investigate the extent to which employees in the Government and Commercial sectors conform to specific male and female stereotypical drives, we can analyze the differences in these drives within and between the two sectors. By examining the data and visualizations, we can identify any significant disparities and understand how these sectors align with or deviate from gender stereotypes.
Through the analysis of data and examination of various factors, several key findings emerged.
Firstly, in section 3.1, significant differences in drives were observed between the Government sector and Commercial industries. On the one hand, the Dominance drive exhibited higher scores in the Commercial sector, indicating a stronger inclination towards assertiveness and control. Similarly, the Decision-Making drive demonstrated higher scores in the Commercial sector, highlighting a greater emphasis on problem solving. On the other hand, the Social empathy drive presented higher scores in the Government sector, thus indicating that Government workers are more empathetic than Commercial workers on average. On the same note, the Helping drive displayed higher scores in the Government sector suggesting that Government workers are more service-oriented than Commercial workers.
Secondly, in section 3.2, patterns of gender-based stereotypical drives were discerned within each sector. In the Government sector, a significant gender disparity was observed in the Dominance drive, with more males displaying a talent for Directing and more females exhibiting Cooperative tendencies. In the Commercial sector, a similar pattern emerged, with more men showing a tendency for Directing and more women leaning towards Cooperative behaviors. The comparisons within each sector further supported these findings. In the Government sector, significant differences were observed between men and women in the Dominance, Decision Making, and Social Empathy drives. Men tended to score higher in Dominance and Decision Making, while women had higher scores in Social Empathy. In the Commercial sector, similar differences were found, with men scoring higher in Dominance and Decision Making, and women scoring higher in Social Empathy. The Helping drive in both sectors presented negligible results meaning that there is not a noteworthy difference between the two genders within each sector. In general, however, the effect sizes for these differences were generally classified as 'small' or 'negligible', indicating relatively small differences between genders.
Furthermore, in section 3.3, patterns of gender-based stereotypical drives were also identified between the Government sector and Commercial industries. However, it is important to note that these differences, although statistically significant, were relatively small in magnitude.
When comparing the two sectors in 3.3, differences were found between men in the Government and Commercial sectors in the Dominance drive, with Commercial men scoring higher. However, the effect size for this difference was classified as 'negligible'. Additionally, it is worth noting that when examining the women participants in both the Government and Commercial sectors, no statistically significant differences were observed in their Dominance drive scores. It seems that the variation in Dominance drive was primarily driven by differences among men in these sectors. However, it is important to highlight that even among men, the effect size for the disparity in Dominance drive between the Government and Commercial sectors was classified as 'negligible'. In other words, while a slightly higher proportion of Commercial men scored higher in Dominance drive compared to Government men, the actual difference was minimal.
Furthermore, in terms of Decision making, a similar pattern emerged, with a slightly larger number of Commercial men scoring higher in this area compared to Government men. However, once again, the effect size was considered 'negligible'. These findings suggest that while there may be subtle disparities between men in the Government and Commercial sectors when it comes to Dominance drive and Decision making, the practical significance of these differences is minimal.
Interestingly, when examining social empathy and helping, it was found that more Government men scored higher in this attribute compared to their Commercial counterparts. Ιt highlights a potential trend where Government men might possess a slight advantage in terms of social empathy and helping the public in general. However, it is essential to emphasize that the variations observed in these two drives were relatively small, reinforcing the notion that the dissimilarities between the sectors, especially among women, were negligible.
In summary, the analysis indicates that while there were some subtle distinctions between men in the Government and Commercial sectors, the differences were not statistically significant and classified as 'negligible'. Moreover, women participants across both sectors did not demonstrate any notable variations in their attributes. These findings suggest that the overall dissimilarities between the Government and Commercial sectors, in terms of the measured psychological traits, are relatively minimal.
4.1. Limitations
To begin with, the dataset limited the research as it contained far too many missing values in variables of interest like Age, Educational level, Primary job and Position, thus cutting down the investigated datasets to their 1/4th. If they were to be used, a more in-depth analysis would be performed. Resolving the missing data problems would either lead to a significant loss of information or would result in inaccurate conclusions.
Furthermore, another limitation was that the Competencies, which are the abilities of a person and can be influenced and developed in a workplace unlike Drives, were not applied correctly in the dataset that was provided to us for the research. They would be more versatile to work with since they would more easily be influenced by demographic factors and would allow us to perform a more complex and interesting analysis.
The lack of a variable that measures success like salary or job performance. If one were to be included in the dataset, then machine learning prediction models could be applied in order to estimate from an employee’s drives or competencies their salary or job performance and include many influencing variables like gender and age to see how they interact with each other.
Lastly, while the comparisons between and within sectors are bias-free due to the controlled randomization of the populations in order to equalize them, there is still a randomness factor. Especially when comparing g_man, g_woman, c_man, and c_woman, having reduced them to 5000 of each results in some amount of data loss and if a different subset of data were to be selected then the results would show a mild
difference from the ones presented in the study.
4.2. Research question answer
Considering the overall analysis, including the differences observed within each sector, as well as the disparities between the Government and Commercial sectors, it can be concluded that while some gender-biased drives exist in both sectors, the extent to which employees adhere to these stereotypes is relatively small. The findings suggest that gender stereotypes related to Dominance, Decision Making, Social Empathy, and Helping are not strongly prevalent or pronounced within the Government and Commercial sectors. The largest differences were noticed in two cases: Men value Dominance more than women, while women value Social Empathy more than men.
To better understand why there are differences between genders in the workplace, we need to investigate various factors like how organizations are structured, the cultural norms that influence people's behavior, and the personal experiences that individuals have. It's important to take steps to ensure that men and women have equal opportunities to make decisions and create a work environment where everyone's strengths and perspectives are valued.
As this research is going to act as a roadmap for TMA, efforts should be made to promote gender equality in decision-making processes within both the Government and Commercial sectors in order to combat even these ‘small’ findings of gender bias. This can involve creating more inclusive and diverse leadership teams, implementing fair and unbiased promotion criteria, and providing training and development opportunities to individuals from underrepresented groups.
Overall, this study sheds light on the existence of gender-biased drives in the Government sector and Commercial industries. It underscores the importance of recognizing and challenging gender stereotypes to foster workplace environments that encourage equal opportunities and fair treatment for all employees, regardless of gender.
5. Bibliography
Altman, D. G., & Bland, J. M. (2005). Standard deviations and standard errors. BMJ, 331(7521), 903. https://doi.org/10.1136/bmj.331.7521.903
Amabile, T. M., & Khaire, M. (2008). Creativity and the role of the leader. Harvard Business Review, 86(10), 100-109. https://www.eabhigyan.com/pluginfile.php/104330/mod_resource/content/1/Growth_Oct-Dec_08.pdf#page=54
Buelens, M., & Van den Broeck, H. (2007). An Analysis of Differences in Work Motivation between Public and Private Sector Organizations. Public Administration Review, 67(1),
65–74. https://onlinelibrary.wiley.com/doi/pdf/10.1111/j.1540-6210.2006.00697.x?casa_token=UHCVhyL4jT0AAAAA:RBd2f-i4Bnl316cpPo_azIyZEgYWnt5nbowFu011jrEHY76pp7hbyP7jSTRHDH3gftX9IyomcH-_Ng
Brown, M. E., Treviño, L. K., & Harrison, D. A. (2005). Ethical leadership: A social learning perspective for construct development and testing. Organizational Behavior and Human Decision Processes, 97(2), 117–134. https://doi.org/10.1016/j.obhdp.2005.03.002
Carli, L. L. (2001). Gender and Social Influence. Journal of Social Issues, 57(4), 725–741. https://doi.org/10.1111/0022-4537.00238
Eagly, A., & Carli, L. (2007). Women and the labyrinth of leadership. Harvard
Business Review, 85, 62–71, 146. https://doi.org/10.1037/e664062007-001
Eagly, A. H., & Karau, S. J. (2002). Role congruity theory of prejudice toward female leaders. Psychological Review, 109(3), 573–598. https://doi.org/10.1037/0033-295X.109.3.573
Ghosh, S. K., Burns, C. B., Prager, D. L., Zhang, L., & Hui, G. (2018). On nonparametric estimation of the latent distribution for ordinal data. Computational Statistics & Data Analysis, 119, 86–98. https://doi.org/10.1016/j.csda.2017.10.001
Goedhart, J. (2016). Calculation of a distribution free estimate of effect size and
confidence intervals using VBA/Excel (p. 073999). bioRxiv. https://doi.org/10.1101/073999
Heilman, M. E. (2012). Gender stereotypes and workplace bias. Research in Organizational Behavior, 32, 113–135. https://doi.org/10.1016/j.riob.2012.11.003.
Hoffman, M. L. (2011). Is empathy necessary for morality? In A. Coplan & P. Goldie
(Eds), Empathy: Philosophical and psychological perspectives (pp. 231-254). New York: Oxford University Press.
Hofstede, G. (2001). Culture’s Consequences: Comparing Values, Behaviors, Institutions and Organizations Across Nations. SAGE.
Hood, C. (1995). The “new public management” in the 1980s: Variations on a theme. Accounting, Organizations and Society, 20(2), 93–109. https://doi.org/10.1016/0361-3682(93)E0001-W
Liddell, T. M., & Kruschke, J. K. (2018). Analyzing ordinal data with metric models: What could possibly go wrong? Journal of Experimental Social Psychology, 79, 328–348. https://doi.org/10.1016/j.jesp.2018.08.009
Macbeth, G., Razumiejczyk, E., & Ledesma, R. (2011). Cliff’s Delta Calculator: A non-parametric effect size program for two groups of observations. Universitas Psychologica, 10, 545–555. https://doi.org/10.11144/Javeriana.upsy10-2.cdcp
Mann, H. B., & Whitney, D. R. (1947). On a Test of Whether one of Two Random Variables is Stochastically Larger than the Other. The Annals of Mathematical Statistics, 18(1), 50–60. http://www.jstor.org/stable/2236101
Miller, F., Katz, J. (2002). The inclusion breakthrough: Unleashing the real power of
diversity. Choice Reviews Online, 40(04), 40-2262-40–2262. https://doi.org/10.5860/CHOICE.40-2262
Mousa, M., Ayoubi, R., & Massoud, H. (2020). Gender, workplace fun and organisational inclusion: An empirical study. EuroMed Journal of Business, 16(4), 512–525. https://doi.org/10.1108/EMJB-12-2019-0149
Nachar, N. (2008). The Mann-Whitney U: A Test for Assessing Whether Two Independent Samples Come from the Same Distribution. Tutorials in Quantitative Methods for Psychology, 4(1), 13–20. https://doi.org/10.20982/tqmp.04.1.p013
Schein, E. H. (1990). Organizational culture. American Psychologist, 45, 109–119. https://doi.org/10.1037/0003-066X.45.2.109 (https://cmapspublic.ihmc.us/rid=1GSGS9M3P-8BFNGM Q8Z/what%20you%20need%20to%20know%20about%20org%20culture%20schein.pdf)
Sharma, G. (2017). Pros and cons of different sampling techniques.
https://d1wqtxts1xzle7.cloudfront.net/58765080/Pros_and_cons_of_sampling-libre.pdf 1554136080=&response-content disposition=inline%3B+filename%3DImpact_Factor_5_2_IJAR.pdf&Expires=168754439 &Signature=YO8ep4ZPLi~lJJ0OxOlcaMA7rMHiCUGZBhlphzItLax7NUY5sqsfwbb3wT~TtLJ4uwTuyiGGMp4sQcy5fnDGnWTZYR8xN8Sc9XKZczd7jLxWZruDbCJ8hc0IHBEyRJ2a0v2fT4WjXmMoSKiwI4ogCB5bRp3oNznwEg~o5-v~ncYjVh8xLK4j9pMnJYInaPuEspqenGpXQlJREvZ3P0O1Roqn7G~TiGHE4maLgxiJFBXD7U0C4SxXOOIlLLKqnaQ0qJhZiPULeKVZJLkLrgVzgejeYZq9UmzuXngY2P9ncmrrHoSdP2OxLzLQtnXkFy4XM4ki5w~TXyBjUJjv3zpcyg__&Key-Pair-Id=APKAJLOHF5GGSLRBV4ZA
Sokoloff, W. (2012). Empathy and democracy: Feeling, thinking and deliberation. Contemporary Political Theory, 11. https://doi.org/10.1057/cpt.2011.14
Stead, N. J. (2009). The Effect of Age and Gender on Motivation to Work. Working to live or living to work? The impact of time demands and preferred working hours on work and family outcomes, 129-133. https://www.researchgate.net/profile/Carolyn-Timms/publication/42622345_Working_to_live_or_living_to_work_The_impact_of_time_demands_and_preferred_working_hours_on_work_and_family_outcomes/links/0912f50a5361f75edb000000/Working-to-live-or-living-to-work-The-impact-of-time-demands-and-preferred-working-hours-on-work-and-family-outcomes.pdf#page=130
Wan, Z., Xia, X., Lo, D., & Murphy, G. C. (2021). How does Machine Learning Change Software Development Practices? IEEE Transactions on Software Engineering, 47(9), 1857–1871. https://doi.org/10.1109/TSE.2019.2937083
Meer blogs

Utrechtse studenten hebben veel talent
De Universiteit Utrecht vindt het belangrijk dat studenten hun talenten ontdekken en ontwikkelen. Dankzij de NPO gelden hebben alle studenten de mogelijkheid gekregen om een TMA Talentenanalyse te maken en op deze manier inzicht te krijgen in hun eigen talenten. Op dit moment hebben al bijna 1000 studenten hier gebruik van gemaakt.

Behouden is het nieuwe werven
Het aantrekken en behouden van medewerkers is steeds lastiger. Hoe kunnen organisaties er in zo’n lastige tijd en markt toch voor zorgen dat ze goed personeel vinden en voor langere tijd aan zich binden? Over die vraag bogen HDLG Groep en TMA zich in een uitgebreid onderzoek voor de technische sector, met een focus op talent én werkomgeving.

‘Mensen hoeven niet van alles te veranderen aan zichzelf’
Roos Casemier zag in haar jeugd veel ongelijkheid en dat zette haar aan het denken. Waarom merkte zij de kracht in al die verschillende mensen op en hun omgeving vaak niet? Het werd uiteindelijk de rode draad in haar carrière: mensen (weer) laten inzien wat ze waard zijn. Dat doet ze nu in haar eigen coachingpraktijk met behulp van de TMA Methode en haar intuïtieve manier van werken.
Praktijkboek Van Talent naar Performance
We delen graag onze kennis dus maken we ons handboek gratis voor jullie beschikbaar. Download het of bestel een exemplaar.